HARBOR GATEWAY · TORRANCE, CA 90501 · PROPERTY ID 2122427
Property information presented as reported in CoStar. Availability and figures below reflect the source report, including source-reported inconsistencies.
Property details and summary panels from the CoStar report.
Building
Type
4 Star Industrial Warehouse
Park
Harbor Gateway
Location
Urban
RBA
685,897 SF
Stories
1
Typical Floor
8,191 SF
Class
A
Tenancy
Multi
Owner Occup
No
Docks
38 ext
Drive Ins
2 tot.
Cross Docks
None
Levelers
14 ext
Construction
Reinforced Concrete
Building Ht
32'
Truck Wells
Yes
Truck Court
150'
Clear Height
30'
Columns
52'w x 52'd
Elevators
None
Sprinklers
ESFR
Rail Spots
None
Year Built
1998
CoStar Est. Rent
$1.36 - 1.66/IG (Industrial)
Building Use
Area
Share
Industrial
664,897 SF
96.9%
Office
21,000 SF
3.1%
Power
800a/277 - 480v 3p 4w Heavy
Utilities
Gas - Natural, Heating, Lighting - LED, Sewer - City, Water - City
Taxes
$0.96/SF (2025)
Opportunity Zone
Yes
Pedestrian Friendly
50 - Fairly friendly
Cycling Friendly
30 - Somewhat friendly
Car Friendly
100 - Exceptionally friendly
Transit Friendly
50 - Fairly friendly
Parking Ratio
13.80/1,000 SF
Parking Spaces
Surface - 113
Green Rating
Energy Star
94 points certified in 2024
Loan
Origination Amount
$25,000,000
Origination Date
9/11/2026
Originator
Northwestern Mutual Life Insur
Maturity Date
10/5/2033
Term
85 Months
Loan Type
Conventional
Doc Number
2026.678284
Multi Properties?
Yes
Land
Land SF
1,349,053 SF
Bldg FAR
0.51
Land Acres
30.97 AC
Zoning
M3
Tenants
Name
SF Occupied
White Horse Logistics
369,644
Source: CoStar Research
Lease Activity
Sign Date
Leased
Use
Rent
Services
Rent Type
Oct 2026
315,256 SF
Industrial
$1.60
-
Asking
Dec 2023
315,256 SF
Industrial
-
NNN
-
Dec 2020
314,259 SF
Industrial
$0.99
NNN
Asking
Dec 2020
370,641 SF
Industrial
-
-
-
Jul 2014
315,150 SF
Industrial
$0.63
NNN
Starting
4 Other Leases
Market Conditions
Vacancy Rates
Current
YOY Change
Subject Property
1.2%
-44.8%
Submarket 3-5 Star
7.0%
-1.8%
Market Overall
6.1%
-0.3%
Market Asking Rent Per Area
Current
YOY Change
Subject Property
$1.61/SF
-1.4%
Submarket 3-5 Star
$1.55/SF
-2.9%
Market Overall
$1.45/SF
-3.7%
Submarket Leasing Activity
Current
YOY Change
12 Mo. Leased
3,695,522 SF
247.5%
Months on Market
6.2
-1.1 mo
Submarket Sales Activity
Current
Prev Year
12 Mo. Sales Volume
$382.99M
$136.25M
Market Sale Price Per Area
$348/SF
$357/SF
Primary Contact
Primary Leasing Company
SHOP 310 LLC
Contact
Miriam Choi
Phone
310-307-2508 (c)
Property
For Lease
Smallest Space
8,191 SF
Max Contiguous
8,191 SF
# of Spaces
1
Office Avail
8,191 SF
Vacant
8,191 SF
% Leased
100.0%
Rent
$1.75
Service Type
Industrial Gross
Space
Floor
Available
Use
Rent
Services
P 1st
8,191 SF
Office
$1.75
IG
Documents
PDF · 73 PAGES19100 S. Western Ave Torrance CA 90501 - 2027 BrochureDOWNLOAD BROCHUREIncludes a linked table of contents, property information, photographs and plans.
About the Owner
WS Distribution Group
19100 S Western Avenue, Suite 200 Torrance, CA 90501 United States
WS Distribution Group, formerly Deutsche Asset Management, began in 1956 and has grown into a global asset manager with European roots. The company provides integrated investment solutions across active, passive, and alternative strategies, serving individuals, institutions, and large corporations across a broad range of asset classes. WS Distribution Group maintains a wide international market presence and offers investment expertise built on more than 60 years of experience.
Amenities
Controlled AccessSignageFenced LotSkylightsMonument SignageWheelchair AccessibleOn-Site Security StaffYardSecurity System
Building Notes
This building offers Enterprise zone benefits, 339' 5" truck yard between buildings, dock high (dimensions 8.5' x 10'), and open web truss roof structure.
Public Transportation
Airport
Drive
Distance
Long Beach (Daugherty Field)
15 min
10.2 mi
Los Angeles International
18 min
11.5 mi
Hollywood Burbank
42 min
32.3 mi
Location
Postcode
90501
Submarket
Torrance
Submarket Cluster
South Bay
Location Type
Urban
Market
Los Angeles
County
Los Angeles
State
California
CBSA
Los Angeles-Long Beach-Glendale, CA
DMA
Los Angeles, CA-NV
Country
United States
Public Record
2026 Assessment
Category
2026 Assessment
Per SF
Improvements
$59,584,580
$20.31/SF
Land
$38,235,804
$13.03/SF
Total Value
$97,820,384
$33.35/SF
Parcels
7351-003-013
Demographics
1 mile
3 miles
10 Min. Drive
Population
11,599
207,063
418,057
Households
3,818
70,857
144,866
Median Age
39.60
42.90
42.20
Median HH Income
$83,099
$96,262
$98,735
Daytime Employees
20,098
125,891
214,881
Population Growth '25 - '30
-0.86%
-0.73%
-0.72%
Household Growth '25 - '30
-1.02%
-0.95%
-0.92%
Traffic
Collection Street
Cross Street
Traffic Vol
Last Measured
Distance
195th Street
-
1,656
2026
0.16 mi
South Western Avenue
South Western Avenue N
32,238
2026
0.20 mi
Toyota Way
-
4,471
2026
0.25 mi
W 190th St
Harborgate Way E
29,850
2026
0.28 mi
West 190th Street
South Western Avenue W
30,879
2026
0.33 mi
W 190th St
Harborgate Way W
35,631
2026
0.36 mi
South Western Avenue
South Western Avenue S
30,521
2026
0.36 mi
San Diego Freeway
San Diego Freeway W
174,373
2026
0.39 mi
I 405
-
241,271
2026
0.41 mi
I- 405
S Western Ave W
6,979
2026
0.42 mi
Made with TrafficMetrix® Products
Flood Risk
Flood Risk Area
Moderate to Low Risk Areas
FEMA Flood Zone
B and X Area of moderate flood hazard, usually the area between the limits of the 100-year and 500-year floods.
Floodplain Area
100-year and 500-year
In SFHA
No
FEMA Map Identifier
06037C1935F
FIRM ID
06037C
FIRM Panel Number
1935F
FEMA Map Date
Sep 26, 2008
Flood risk is determined by the footprint of the parcel rather than the footprint of the property.
BUILDING A · CURRENT OFFER
Lease
Current illustrative availability for the full Building A allocation. CoStar lease activity remains below as source-record information.
ENTIRE BUILDING A114,316 SFFULL BUILDING OFFER
Available spaces1 building offer
Max contiguous114,316 SF
Asking rateUpon request
Lease termsUpon request
Offer scopeBuilding A only
Area basisIllustrative allocation
The current illustrative offer covers all of Building A. Pricing, possession, and physical boundaries have not been assigned in this sample.
Lease activity · 2 records
Sign date
Floor
Leased area
Rent
Rent type
Use
Lease type
Expiration
Tenant
Oct 2026
1st
315,256 SF
$1.60
Asking
Industrial
Direct
—
—
Dec 2023
1st
315,256 SF
—
NNN
Industrial
Direct
Dec 2028
National Road Logistics, LLC
COSTAR · PEERS
Peers
Peer properties, map, and comparison statistics from the CoStar Peers report.
COSTAR · MAP
Peer Properties
17 PEERS + SUBJECT
Wider-area CoStar map view using the supplied map tiles; peer map numbers and properties are listed in the table below.
PEERS17
ASKING RENT / SF$16.67
AVAILABILITY RATE77.5%
VACANCY RATE61.1%
Available Space Attributes
Available Space Attributes
Low
Average
Median
High
Available Spaces
1
1
1
1
Available SF
184,331
312,919
254,718
521,856
Max Contiguous SF
184,331
372,426
302,400
581,703
Months On Market
2.83
8.05
5.45
24.02
Asking Rent/SF
$16.56
$16.67
$16.68
$16.80
Property Attributes
Property Attributes
Low
Average
Median
High
Building SF
181,831
308,967
253,318
521,856
Year Built
1973
2004
2002
2025
Clear Height
24 FT
32 FT
32 FT
42 FT
Docks
14
45
35
91
Vacancy Rate
0%
61.1%
100%
100%
Availability Rate
79.8%
77.5%
100%
100%
Star Rating
3.7
Star Rating
3.7
Peer Properties · 17 peers + subject property
Map #
Address
Building Name
Rating
LoopNet Ad Level
Avg Weighted Rent
Direct Service
Building Size SF
Property Type
Secondary Type
Yr Blt/Ren
Clear Height Range
Loading Docks
Available SF
Direct Vacant Space SF
Vacancy Rate
Min Available Space SF
Max Contiguous SF
19100 S. Western Ave
Bldg A
★★★★★
-
$19.20/SF
Triple Net
685,897
Industrial
Warehouse
1998/-
30'0"
38
8,191
0
1.2%
8,191
8,191
1
5885 Plaza Dr
Building 1
★★★★★
Diamond
-
-
204,465
Industrial
Warehouse
2025/-
36'0"
25
204,465
204,465
100%
204,465
581,703
2
2220 E Carson St
★★★★★
-
$16.56/SF
Net
302,400
Industrial
Distribution
1973/-
27'0"
51
302,400
302,400
100%
302,400
302,400
3
5755 Plaza Dr
Building 2
★★★★★
-
-
-
185,344
Industrial
Warehouse
2025/-
36'0"
25
185,344
185,344
100%
185,344
581,703
4
15300 Desman Rd
★★★★★
-
-
-
254,718
Industrial
Warehouse
1999/-
41'0"
52
254,718
254,718
100%
254,718
254,718
5
303-335 W Artesia Blvd
★★★★★
Silver
-
-
242,313
Industrial
Distribution
1979/-
24'0"
32
242,313
242,313
100%
242,313
242,313
6
400-450 Westmont Dr
★★★★★
Silver
-
-
513,108
Industrial
Distribution
2001/-
30'0"
91
513,108
-
0%
513,108
513,108
7
6550 Katella Ave
Bldg 2
★★★★★
-
$16.80/SF
Triple Net
341,889
Industrial
Manufacturing
1981/2006
26'0"
14
272,897
272,897
79.8%
125,000
272,897
8
2001 E Dominguez St
Dominguez Commerce Center
★★★★★
Platinum
-
-
429,112
Industrial
Distribution
2025/-
42'0"
68
429,112
429,112
100%
429,112
429,112
9
15301 Shoemaker Ave
★★★★★
Silver
-
-
184,331
Industrial
Warehouse
1976/-
28'0"
24
184,331
184,331
100%
184,331
184,331
10
16501-16509 Trojan Way
★★★★★
Silver
-
-
497,620
Industrial
Distribution
2002/-
32'0"
89
497,620
0
100%
316,651
497,620
11
3690 Union Pacific Ave
★★★★★
Silver
-
-
253,318
Industrial
Distribution
2024/-
36'0"
35
253,318
253,318
100%
253,318
253,318
12
1540 Francisco St
★★★★★
-
-
-
206,465
Industrial
Distribution
2000/-
30'0"
33
206,465
-
0%
206,465
206,465
13
2201 E Carson St
2201 E Carson Street
★★★★★
-
-
-
521,856
Industrial
Warehouse
1986/-
28'0"
86
521,856
-
0%
521,856
521,856
14
4800 Conant St
Building 11
★★★★★
-
-
-
219,605
Industrial
Manufacturing
2017/-
32'0"
26
-
-
0%
-
-
15
9615 Norwalk Blvd
★★★★★
-
$19.80/SF
Triple Net
201,571
Industrial
Distribution
2025/-
32'0"
35
-
201,571
100%
-
-
16
20333 Normandie Ave
Bridge Point South Bay
★★★★★
-
$21.00/SF
Triple Net
512,490
Industrial
Distribution
2018/-
36'0"
56
-
-
0%
-
-
17
112 W Alondra Blvd
Building 1
★★★★★
-
-
-
181,831
Industrial
Manufacturing
2025/-
36'0"
27
-
181,831
100%
-
-
COSTAR · SALE
Sale
Nearby sale comparables and prior sales from the CoStar Sale tab.
Prior Sales
Prior Sale information is not available.
Nearby Sale Comparables
Address
Name
Rating
Yr Blt/Renov
Type
Size
Dist (mi)
Sale Date
Sale Price
Price/SF
% Leased
Submarket
1501-1601 E Cerritos Ave
★★★★★
1968
Industrial
406,787 SF
23.97
Jan 2025
$124,000,000
$304.83
100%
Anaheim
1050 S State College Blvd
★★★★★
1974
Industrial
417,320 SF
24.00
Sep 2025
$145,000,000
$347.46
100%
Fullerton
9400-9500 Santa Fe Springs Rd
SFS Logistics Center
★★★★★
1979
Industrial
595,304 SF
15.93
Sep 2026
$128,000,000
$215.02
69%
Santa Fe Springs/La Mirada
3963 Workman Mill Rd
Building A and B
★★★★★
2005
Industrial
346,381 SF
18.79
Sep 2026
$88,400,000
$255.21
100%
City of Industry
COSTAR · TENANT
Tenant
CoStar tenant record and a separate illustrative leasing schedule for Buildings A–F.
Illustrative Leasing Schedule · Buildings A–F
Building
Tenant / status
Area
Assumed rent / SF / month
Lease basis
A
Available
114,316 SF
$1.75
Industrial Gross
B
Pacific Gate Logistics
114,316 SF
$1.45
NNN
C
Harborline Fulfillment
114,316 SF
$1.50
NNN
D
South Bay Components
114,316 SF
$1.55
NNN
E
Western Coast Supply
114,316 SF
$1.60
NNN
F
Gateway Packaging
114,317 SF
$1.65
NNN
Fictional tenant names and monthly rent assumptions for this marketing concept. The CoStar tenant record below remains separate.
Tenants · 1 Tenant
Tenant
Industry
Floor
SF Occupied
# Emps
Move Date
Exp Date
White Horse Logistics
Transportation and Warehousing
1st
369,644
-
-
-
CoStar Research
Stacking Plan
1st:
685,897 SF
White Horse Logistics369,644 SF
White Horse Logistics · 369,644 SFBuilding A available · 114,316 SF · illustrative allocationArea not itemized in saved CoStar stacking plan
114,316 SF AvailableBuilding A
Current illustrative offer scope: all of Building A, 114,316 SF. CoStar lease and availability fields elsewhere preserve the uploaded report snapshot.
AvailableMoving OutMoving InMy DataShared Data
COSTAR · ANALYTICS
Analytics
Property, submarket 3-5 star, and submarket values from the CoStar Analytics tab.
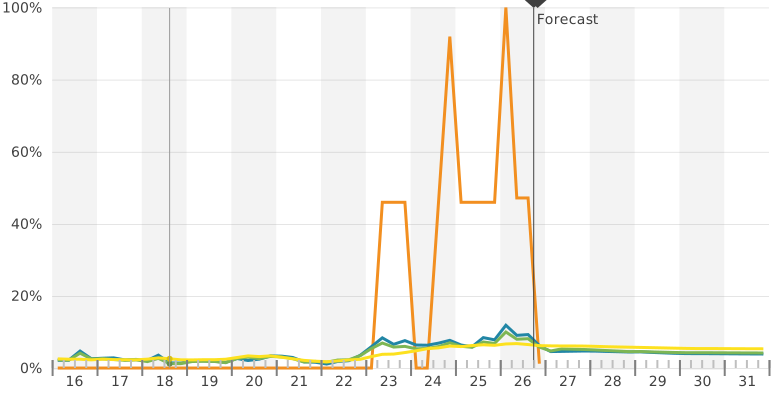
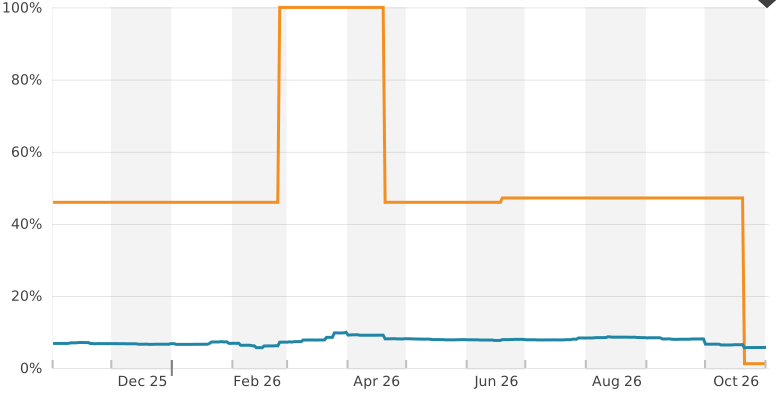
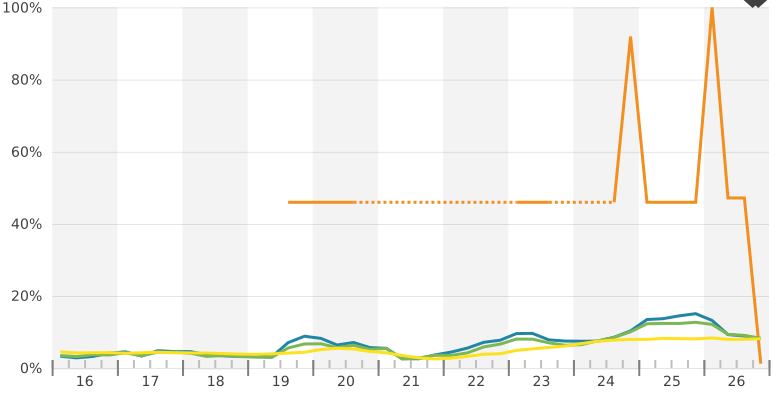
Vacancy Rate
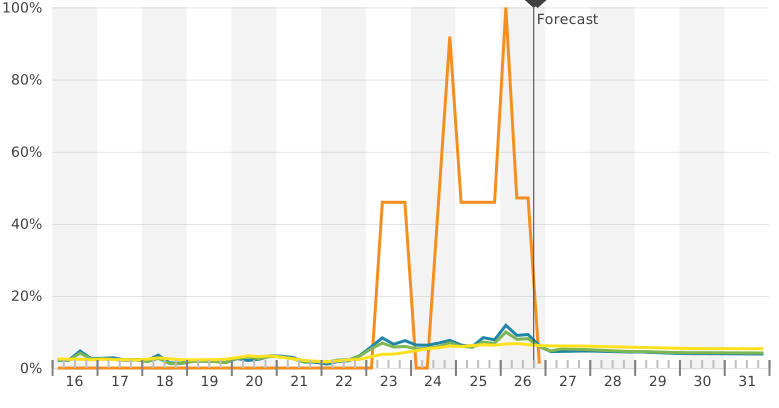
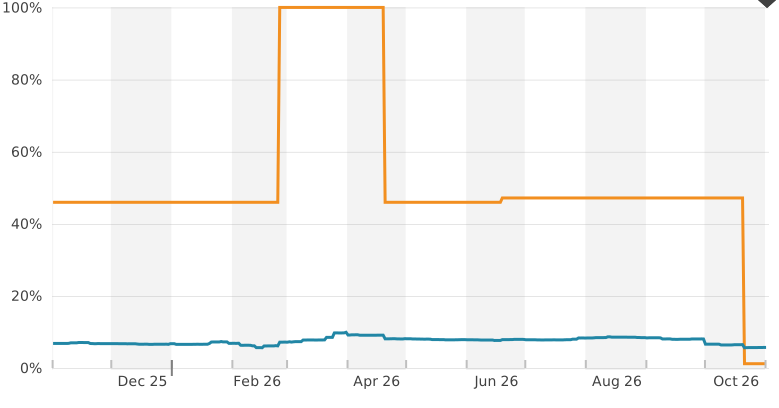
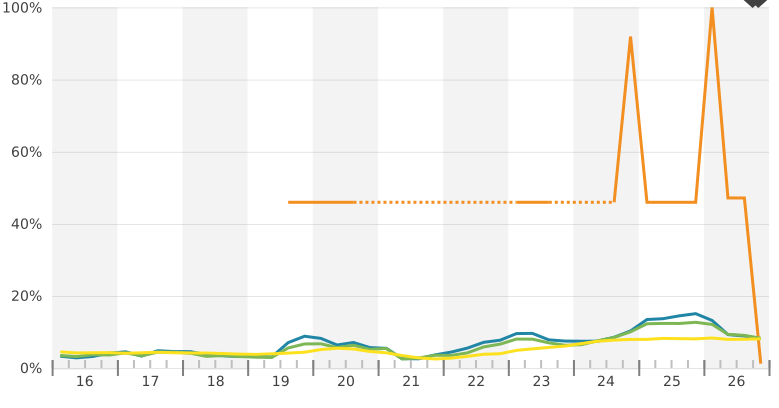
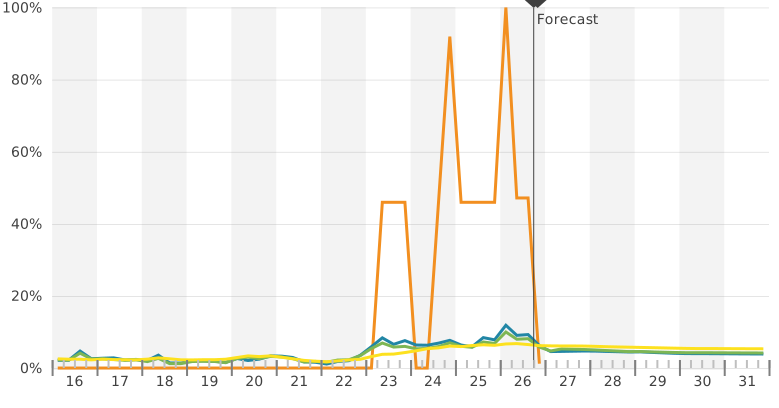
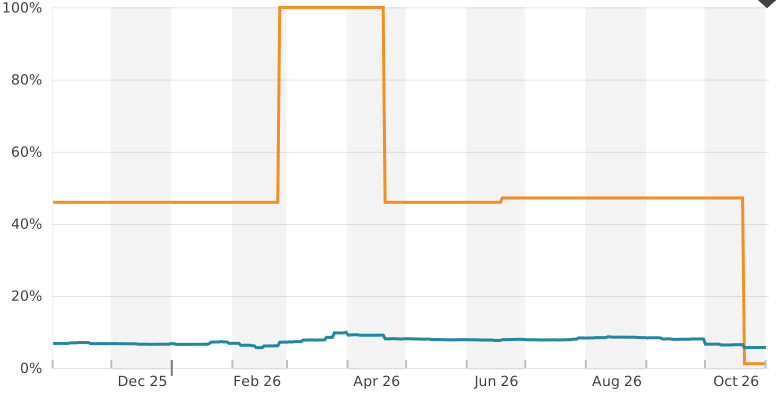
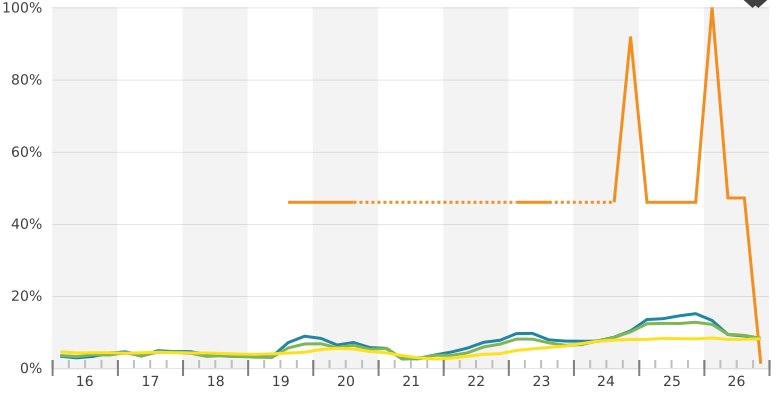
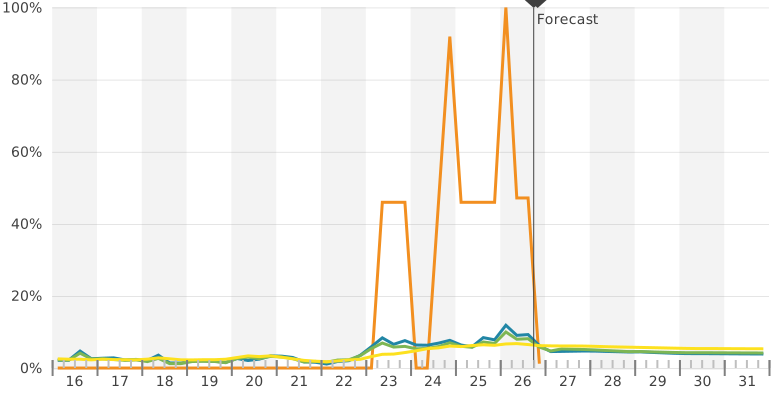
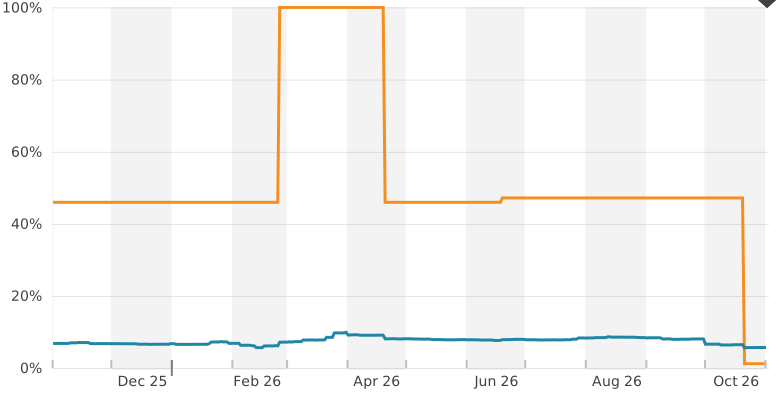
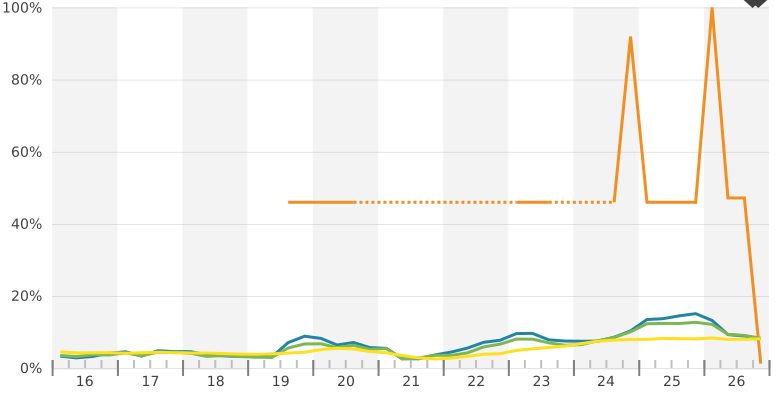
Daily Vacancy Rate
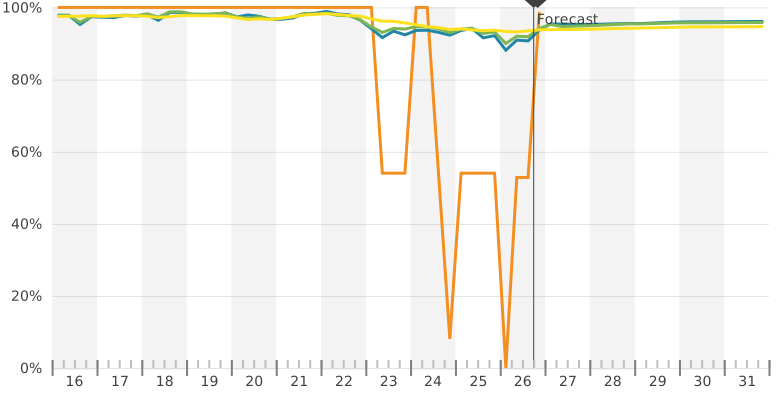
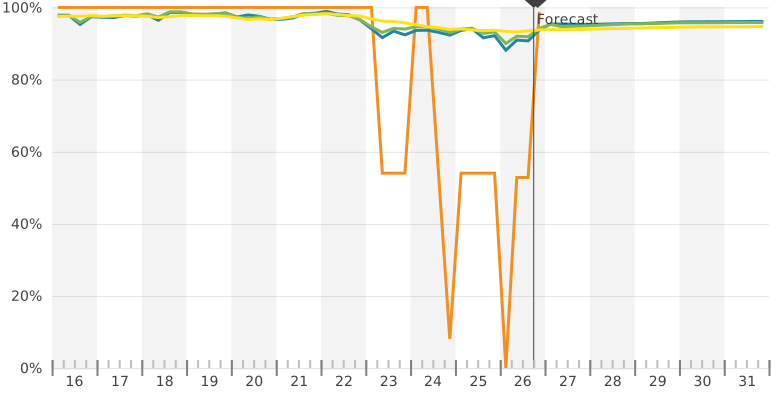
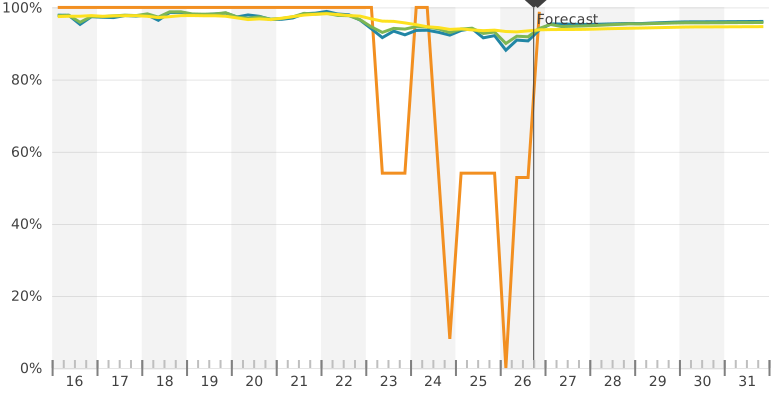
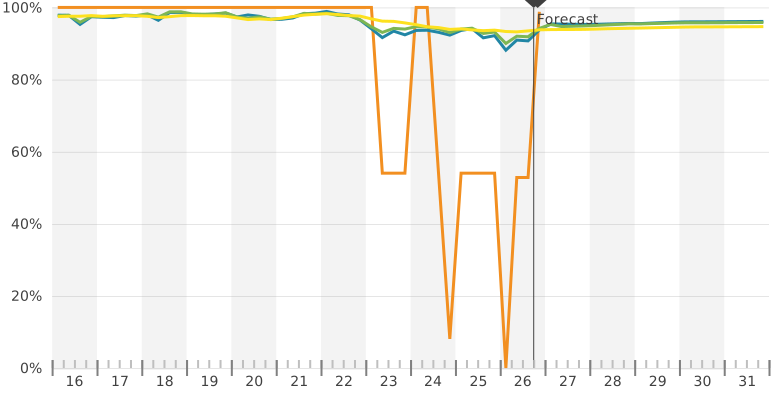
Availability Rate
Occupancy Rate
Leasing Activity
Chart not present in the saved source export.
Availability & Vacancy Rate
Chart not present in the saved source export.
Market Asking Rent Per SF
Chart not present in the saved source export.
Market Asking Rent Growth (YOY)
Chart not present in the saved source export.
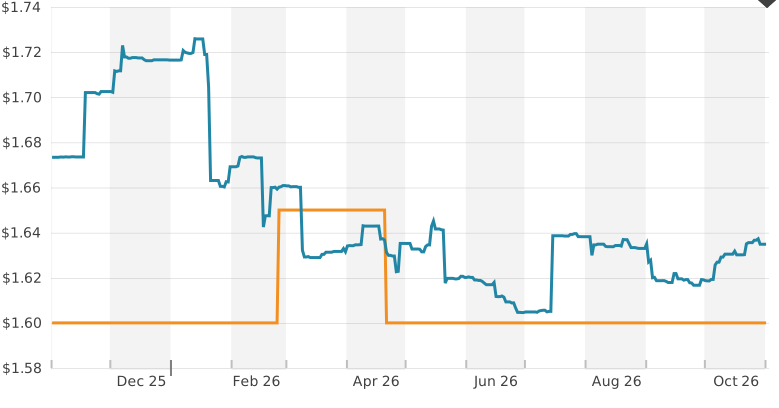
Daily Asking Rent Per SF
Chart not present in the saved source export.
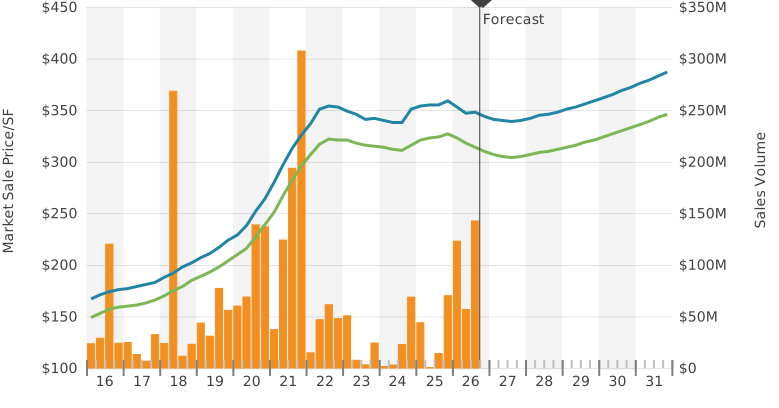
Sales Volume & Market Sale Price Per SF
Chart not present in the saved source export.
Sales Volume
Chart not present in the saved source export.
Market Sale Price Per SF
Chart not present in the saved source export.
Market Cap Rate
Chart not present in the saved source export.
AVAILABILITY
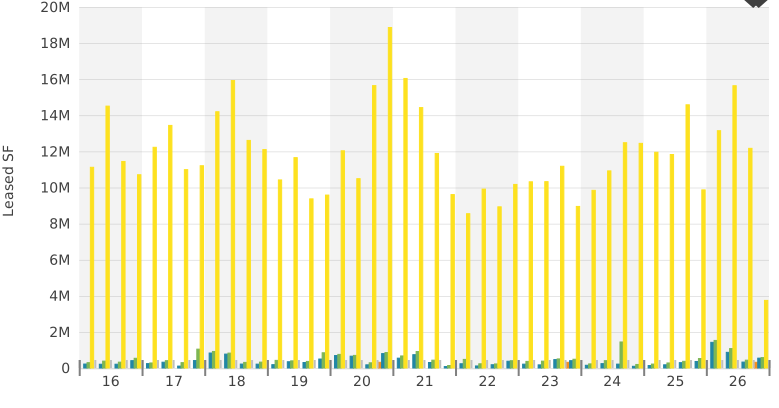
AVAILABILITY
PROPERTY
SUBMARKET 3-5 STAR
SUBMARKET
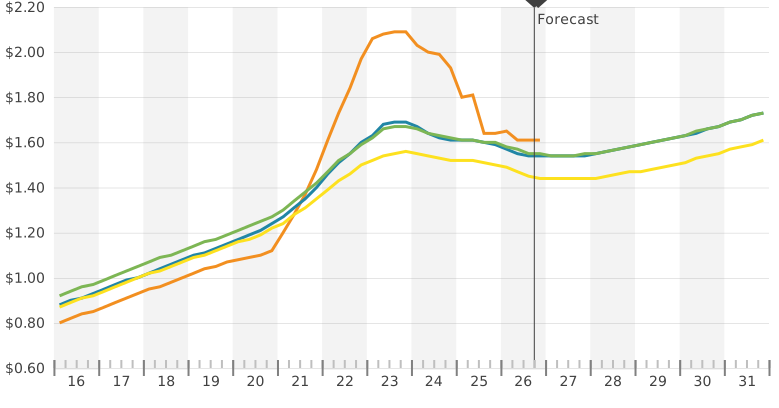
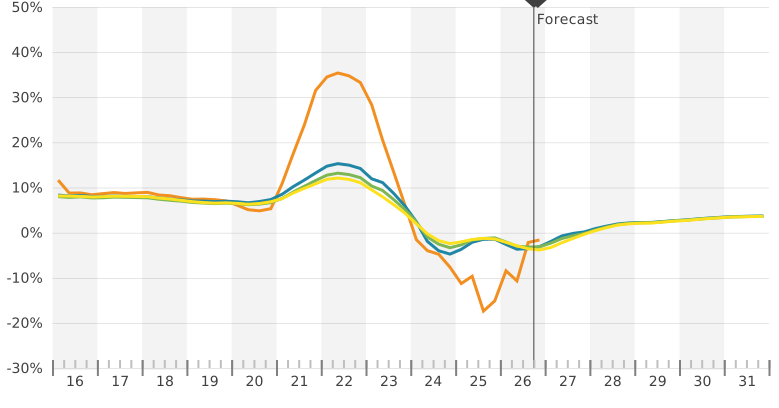
Market Asking Rent/SF
$1.61
$1.55
$1.55
Vacancy Rate
1.2%
7.8%
6.3%
Vacant SF
8.2K
2M
2.3M
Availability Rate
1.2%
9.8%
8.2%
Available SF Direct
0
1.8M
2.2M
Available SF Sublet
8.2K
929K
937K
Available SF Total
8.2K
2.5M
3M
Months on Market
4.6
6.7
5.2
DEMAND
DEMAND
PROPERTY
SUBMARKET 3-5 STAR
SUBMARKET
12 Mo Net Absorption SF
307K
293K
314K
12 Mo Leased SF
315K
3.6M
3.9M
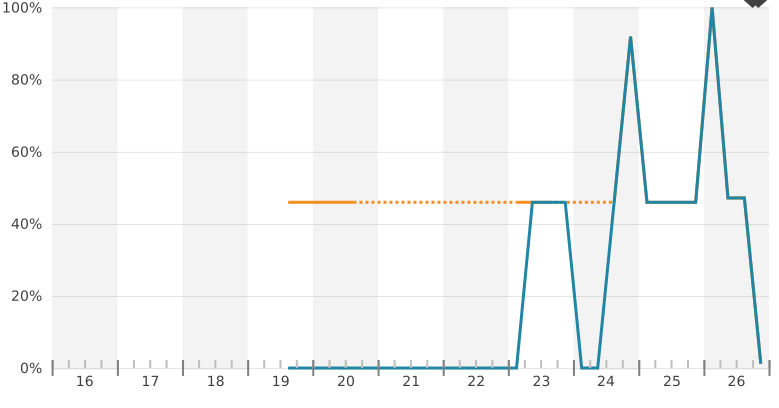
6 Mo Leasing Probability
-
45.6%
57.2%
INVENTORY
INVENTORY
PROPERTY
SUBMARKET 3-5 STAR
SUBMARKET
Existing Buildings
1
387
978
Inventory SF
686K
25.2M
35.9M
Average Building SF
-
65.1K
36.7K
Under Construction SF
-
472K
472K
12 Mo Delivered SF
-
115K
115K
SALES
SALES
PROPERTY
SUBMARKET 3-5 STAR
SUBMARKET
12 Mo Transactions
-
14
19
Market Sale Price/SF
-
$351
$348
Average Market Sale Price
-
$23M
$12.9M
12 Mo Sales Volume
-
$368M
$383M
Market Cap Rate
-
5.2%
5.4%
Saved Analytics Views
Summary
Vacancy Rate
Daily Vacancy Rate
Availability Rate
Occupancy Rate
Leasing Activity
Chart not present in the saved source export.
Availability & Vacancy Rate
Chart not present in the saved source export.
Market Asking Rent Per SF
Chart not present in the saved source export.
Market Asking Rent Growth (YOY)
Chart not present in the saved source export.
Daily Asking Rent Per SF
Chart not present in the saved source export.
Sales Volume & Market Sale Price Per SF
Chart not present in the saved source export.
Sales Volume
Chart not present in the saved source export.
Market Sale Price Per SF
Chart not present in the saved source export.
Market Cap Rate
Chart not present in the saved source export.
AVAILABILITY
AVAILABILITY
PROPERTY
SUBMARKET 3-5 STAR
SUBMARKET
Market Asking Rent/SF
$1.61
$1.55
$1.55
Vacancy Rate
1.2%
7.8%
6.3%
Vacant SF
8.2K
2M
2.3M
Availability Rate
1.2%
9.8%
8.2%
Available SF Direct
0
1.8M
2.2M
Available SF Sublet
8.2K
929K
937K
Available SF Total
8.2K
2.5M
3M
Months on Market
4.6
6.7
5.2
DEMAND
DEMAND
PROPERTY
SUBMARKET 3-5 STAR
SUBMARKET
12 Mo Net Absorption SF
307K
293K
314K
12 Mo Leased SF
315K
3.6M
3.9M
6 Mo Leasing Probability
-
45.6%
57.2%
INVENTORY
INVENTORY
PROPERTY
SUBMARKET 3-5 STAR
SUBMARKET
Existing Buildings
1
387
978
Inventory SF
686K
25.2M
35.9M
Average Building SF
-
65.1K
36.7K
Under Construction SF
-
472K
472K
12 Mo Delivered SF
-
115K
115K
SALES
SALES
PROPERTY
SUBMARKET 3-5 STAR
SUBMARKET
12 Mo Transactions
-
14
19
Market Sale Price/SF
-
$351
$348
Average Market Sale Price
-
$23M
$12.9M
12 Mo Sales Volume
-
$368M
$383M
Market Cap Rate
-
5.2%
5.4%
Vacancy
Vacancy Rate
Daily Vacancy Rate
Availability Rate
Occupancy Rate
Leasing Activity
Chart not present in the saved source export.
Availability & Vacancy Rate
Chart not present in the saved source export.
Market Asking Rent Per SF
Chart not present in the saved source export.
Market Asking Rent Growth (YOY)
Chart not present in the saved source export.
Daily Asking Rent Per SF
Chart not present in the saved source export.
Sales Volume & Market Sale Price Per SF
Chart not present in the saved source export.
Sales Volume
Chart not present in the saved source export.
Market Sale Price Per SF
Chart not present in the saved source export.
Market Cap Rate
Chart not present in the saved source export.
AVAILABILITY
AVAILABILITY
PROPERTY
SUBMARKET 3-5 STAR
SUBMARKET
Market Asking Rent/SF
$1.61
$1.55
$1.55
Vacancy Rate
1.2%
7.8%
6.3%
Vacant SF
8.2K
2M
2.3M
Availability Rate
1.2%
9.8%
8.2%
Available SF Direct
0
1.8M
2.2M
Available SF Sublet
8.2K
929K
937K
Available SF Total
8.2K
2.5M
3M
Months on Market
4.6
6.7
5.2
DEMAND
DEMAND
PROPERTY
SUBMARKET 3-5 STAR
SUBMARKET
12 Mo Net Absorption SF
307K
293K
314K
12 Mo Leased SF
315K
3.6M
3.9M
6 Mo Leasing Probability
-
45.6%
57.2%
INVENTORY
INVENTORY
PROPERTY
SUBMARKET 3-5 STAR
SUBMARKET
Existing Buildings
1
387
978
Inventory SF
686K
25.2M
35.9M
Average Building SF
-
65.1K
36.7K
Under Construction SF
-
472K
472K
12 Mo Delivered SF
-
115K
115K
SALES
SALES
PROPERTY
SUBMARKET 3-5 STAR
SUBMARKET
12 Mo Transactions
-
14
19
Market Sale Price/SF
-
$351
$348
Average Market Sale Price
-
$23M
$12.9M
12 Mo Sales Volume
-
$368M
$383M
Market Cap Rate
-
5.2%
5.4%
Rent
Vacancy Rate
Daily Vacancy Rate
Availability Rate
Occupancy Rate
Leasing Activity
Availability & Vacancy Rate
Market Asking Rent Per SF
Market Asking Rent Growth (YOY)
Daily Asking Rent Per SF
Sales Volume & Market Sale Price Per SF
Sales Volume
Chart not present in the saved source export.
Market Sale Price Per SF
Chart not present in the saved source export.
Market Cap Rate
Chart not present in the saved source export.
AVAILABILITY
AVAILABILITY
PROPERTY
SUBMARKET 3-5 STAR
SUBMARKET
Market Asking Rent/SF
$1.61
$1.55
$1.55
Vacancy Rate
1.2%
7.8%
6.3%
Vacant SF
8.2K
2M
2.3M
Availability Rate
1.2%
9.8%
8.2%
Available SF Direct
0
1.8M
2.2M
Available SF Sublet
8.2K
929K
937K
Available SF Total
8.2K
2.5M
3M
Months on Market
4.6
6.7
5.2
DEMAND
DEMAND
PROPERTY
SUBMARKET 3-5 STAR
SUBMARKET
12 Mo Net Absorption SF
307K
293K
314K
12 Mo Leased SF
315K
3.6M
3.9M
6 Mo Leasing Probability
-
45.6%
57.2%
INVENTORY
INVENTORY
PROPERTY
SUBMARKET 3-5 STAR
SUBMARKET
Existing Buildings
1
387
978
Inventory SF
686K
25.2M
35.9M
Average Building SF
-
65.1K
36.7K
Under Construction SF
-
472K
472K
12 Mo Delivered SF
-
115K
115K
SALES
SALES
PROPERTY
SUBMARKET 3-5 STAR
SUBMARKET
12 Mo Transactions
-
14
19
Market Sale Price/SF
-
$351
$348
Average Market Sale Price
-
$23M
$12.9M
12 Mo Sales Volume
-
$368M
$383M
Market Cap Rate
-
5.2%
5.4%
Sales
Sales Volume & Market Sale Price Per SF
Chart not present in the saved source export.
Sales Volume
Chart not present in the saved source export.
Market Sale Price Per SF
Chart not present in the saved source export.
Market Cap Rate
Chart not present in the saved source export.
SALES
SALES
PROPERTY
SUBMARKET 3-5 STAR
SUBMARKET
12 Mo Transactions
-
14
19
Market Sale Price/SF
-
$351
$348
Average Market Sale Price
-
$23M
$12.9M
12 Mo Sales Volume
-
$368M
$383M
Market Cap Rate
-
5.2%
5.4%
Data
AVAILABILITY
AVAILABILITY
PROPERTY
SUBMARKET 3-5 STAR
SUBMARKET
Market Asking Rent/SF
$1.61
$1.55
$1.55
Vacancy Rate
1.2%
7.8%
6.3%
Vacant SF
8.2K
2M
2.3M
Availability Rate
1.2%
9.8%
8.2%
Available SF Direct
0
1.8M
2.2M
Available SF Sublet
8.2K
929K
937K
Available SF Total
8.2K
2.5M
3M
Months on Market
4.6
6.7
5.2
DEMAND
DEMAND
PROPERTY
SUBMARKET 3-5 STAR
SUBMARKET
12 Mo Net Absorption SF
307K
293K
314K
12 Mo Leased SF
315K
3.6M
3.9M
6 Mo Leasing Probability
-
45.6%
57.2%
INVENTORY
INVENTORY
PROPERTY
SUBMARKET 3-5 STAR
SUBMARKET
Existing Buildings
1
387
978
Inventory SF
686K
25.2M
35.9M
Average Building SF
-
65.1K
36.7K
Under Construction SF
-
472K
472K
12 Mo Delivered SF
-
115K
115K
SALES
SALES
PROPERTY
SUBMARKET 3-5 STAR
SUBMARKET
12 Mo Transactions
-
14
19
Market Sale Price/SF
-
$351
$348
Average Market Sale Price
-
$23M
$12.9M
12 Mo Sales Volume
-
$368M
$383M
Market Cap Rate
-
5.2%
5.4%
COSTAR · LOAN
Loan
Financing information shown in the CoStar Loan tab.
Loan details
Origination amount
$25,000,000
Origination date
September 11, 2026
Originator
Northwestern Mutual Life Insurance
Maturity date
October 5, 2033
Term
85 months
Loan type
Conventional
Multi-property loan
Yes
Document number
2026.678284
COSTAR · FINANCIALS
Financials
Market financials for Los Angeles, California · Industrial. Values per SF, as reported in CoStar.
Market Financials
Most Recent
2025
2024
2023
Number of Months Covered
-
12
12
12
Statement Ending Date
-
Dec 31, 2025
Dec 31, 2024
Dec 31, 2023
Income
Base Rent
$15.90
$23.98
$34.68
$28.32
Expense Reimbursement
$5.12
$6.56
$8.76
$6.10
Percentage Rent
-
-
-
$0.02
Parking Income
$0.35
$0.18
$0.11
$0.23
Other Income
$7.62
$3.44
$2.67
$2.29
Effective Gross Income
$21.65
$30.27
$42.54
$34.11
Operating Expenses
Real Estate Taxes
$2.68
$3.87
$5.63
$4.31
Property Insurance
$0.67
$0.80
$1.31
$0.87
Utilities
$2.73
$2.00
$0.98
$0.73
Repairs and Maintenance
$1.40
$1.62
$1.94
$1.50
Janitorial
$0.10
$0.04
$0.11
$0.08
Management Fees
$0.78
$0.79
$0.99
$0.83
Payroll & Benefits
$0.11
$0.65
$1.15
$0.79
Advertising & Marketing
$0.16
$0.00
$0.02
$0.06
Professional Fees
$0.06
$0.39
$0.67
$0.35
General & Administrative
$0.43
$0.25
$0.45
$0.51
Other Expenses
$1.04
$1.13
$0.04
$0.03
Ground Rent
-
$1.15
$1.15
$1.15
Total Operating Expenses
$6.94
$8.06
$10.69
$8.41
Operating Expense Ratio (%)
32.08
26.63
25.13
24.65
Net Operating Income
$14.70
$22.21
$31.85
$25.70
Capital Items
Leasing Commissions
$0.13
$0.58
$0.59
$0.62
Tenant Improvements
$0.28
$0.44
$0.67
$0.49
Capital Expenditures
$0.19
$0.26
$0.43
$0.37
Extraordinary Capital Expenditures
-
-
-
$0.18
Total Capital Items
$0.35
$0.84
$1.42
$1.21
Net Cash Flow
$14.35
$21.37
$30.47
$24.53
NOI DSCR
2.51
1.26
0.95
0.92
NCF DSCR
2.45
1.22
0.91
0.88
Occupancy Rate (%)
95.0
93.0
94.0
97.0
Statement ending dates: Most Recent —; 2025 · Dec 31, 2025; 2024 · Dec 31, 2024; 2023 · Dec 31, 2023. Each annual period covers 12 months.
COSTAR · CHANGES
Changes
Property change history from the CoStar Changes tab.
All changes · available report rows
Change date
Change type
New value
Previous value
Notes
10/21/2026
Space Removals
315,256 SF
—
315256 SF Direct Leased
6/15/2026
Space Additions
8,191 SF
—
—
6/3/2026
Leasing Co Changes
Colliers
CBRE
—
5/12/2026
Leasing Co Changes
CBRE
Colliers
—
5/4/2026
Leasing Co Changes
Colliers
CBRE
—
4/20/2026
Space Removals
370,641 SF
—
Withdrawn
2/25/2026
Space Additions
370,641 SF
—
—
2/25/2026
RBA Changes
685,897 SF
684,900 SF
—
8/11/2025
Rental Rate Change
Withheld
Withheld
—
7/29/2025
Rental Rate Change
$1.60
Withheld
—
7/9/2025
Rental Rate Change
Withheld
$1.95/NNN
—
1/28/2025
Space Removals
315,256 SF
—
Withdrawn
10/30/2024
Space Additions
315,256 SF
—
—
8/15/2024
Space Additions
315,256 SF
—
—
8/15/2024
Space Removals
315,256 SF
—
Withdrawn
4/8/2024
RBA Changes
684,900 SF
315,256 SF
—
12/14/2023
Space Removals
315,256 SF
—
315256 SF Direct Leased
4/6/2023
RBA Changes
315,256 SF
684,900 SF
—
3/16/2023
Rental Rate Change
$2.35/NNN
$1.95/NEGOT
—
3/15/2023
Space Additions
315,256 SF
—
—
The downloaded report shows page 1 of 2; this table reproduces the rows visible in the uploaded page.
COSTAR · DEMOGRAPHICS
Demographics
CoStar demographic charts and data, with the 2 miles, 5 miles, and 10 miles geographies retained.
PopulationAnnual Population GrowthPopulation By AgePopulation By RacePopulation By Race & Hispanic OriginEducational AttainmentHouseholdsHousehold SizeHouseholds By IncomeHousehold Income By AgeHousing OccupancyHome ValuesHomes By Year BuiltHousing TypePopulation Travel To WorkConsumer SpendingPer Capita & Avg Household Spending
Daytime Employment
The uploaded page provides the exact employment table below; no chart graphic appears in the saved report.
Consumer Spending By Industry
The uploaded page provides the 2025 and 2030 controls and spending tables below; no industry chart graphic appears in the saved report.
Traffic
The uploaded page provides the traffic count table below; no chart graphic appears in the saved report.
Population
2 miles
5 miles
10 miles
2020 Population
67,401
642,483
2,336,445
2025 Population
65,265
623,692
2,234,209
2030 Population Projection
64,706
618,756
2,208,410
Annual Growth 2020-2025
-0.6%
-0.6%
-0.9%
Annual Growth 2025-2030
-0.2%
-0.2%
-0.2%
Median Age
43
41.3
38.5
Bachelor's Degree or Higher
34%
34%
25%
U.S. Armed Forces
25
602
2,366
Population By Race
2 miles
5 miles
10 miles
White
12,642
146,704
445,710
Black
4,196
88,077
346,625
American Indian/Alaskan Native
692
7,238
37,987
Asian
22,520
136,136
245,636
Hawaiian & Pacific Islander
521
4,394
11,432
Two or More Races
24,693
241,143
1,146,819
Hispanic Origin
25,367
245,862
1,224,688
Housing
2 miles
5 miles
10 miles
Median Home Value
$783,547
$824,451
$805,497
Median Year Built
1960
1965
1960
Households
2 miles
5 miles
10 miles
2020 Households
23,750
219,243
745,927
2025 Households
22,772
211,346
711,434
2030 Household Projection
22,523
209,309
702,710
Annual Growth 2020-2025
0.6%
0.8%
0.5%
Annual Growth 2025-2030
-0.2%
-0.2%
-0.2%
Owner Occupied Households
12,087
108,244
315,575
Renter Occupied Households
10,437
101,065
387,135
Avg Household Size
2.7
2.8
3
Avg Household Vehicles
2
2
2
Total Specified Consumer Spending
$830.3M
$7.8B
$24.4B
Income
2 miles
5 miles
10 miles
Avg Household Income
$122,330
$126,639
$112,070
Median Household Income
$100,391
$98,136
$83,578
< $25,000
2,552
22,803
105,022
$25,000 - 50,000
3,100
28,245
111,769
$50,000 - 75,000
3,365
30,349
108,743
$75,000 - 100,000
2,328
26,231
87,966
$100,000 - 125,000
2,559
23,028
70,969
$125,000 - 150,000
2,189
17,712
52,115
$150,000 - 200,000
3,258
24,763
71,764
$200,000+
3,419
38,216
103,086
Daytime Employment
Radius
2 miles
5 miles
10 miles
Employees
Businesses
Employees Per Business
Employees
Businesses
Employees Per Business
Employees
Businesses
Employees Per Business
Service-Producing Industries
43,193
6,060
7
230,433
30,993
7
672,386
88,345
8
Trade Transportation & Utilities
10,399
891
12
57,726
4,982
12
129,070
13,813
9
Information
1,406
114
12
5,704
538
11
21,159
1,810
12
Financial Activities
2,800
578
5
16,701
3,179
5
54,153
9,667
6
Professional & Business Services
11,982
1,046
11
36,722
4,866
8
91,714
13,414
7
Education & Health Services
8,574
2,488
3
55,386
10,661
5
167,851
28,790
6
Leisure & Hospitality
4,601
406
11
32,259
2,705
12
107,798
7,997
13
Other Services
3,079
514
6
17,207
3,814
5
58,026
11,924
5
Public Administration
352
23
15
8,728
248
35
42,615
930
46
Goods-Producing Industries
18,511
682
27
55,599
3,440
16
114,552
7,955
14
Natural Resources & Mining
70
12
6
293
42
7
743
135
6
Construction
3,999
284
14
12,462
1,659
8
27,228
4,084
7
Manufacturing
14,442
386
37
42,844
1,739
25
86,581
3,736
23
Total Daytime Employment
61,704
6,742
9
286,032
34,433
8
786,938
96,300
8
Consumer Spending
Radius
2 miles
5 miles
10 miles
Expand All
Total Spending
Avg Household
Per Capita
Total Spending
Avg Household
Per Capita
Total Spending
Avg Household
Per Capita
Apparel
$43,094,820
$1,892
$660
$407,505,309
$1,928
$653
$1,358,063,321
$1,909
$608
Entertainment, Hobbies & Pets
$112,874,263
$4,957
$1,729
$1,084,022,793
$5,129
$1,738
$3,384,675,794
$4,758
$1,515
Food & Alcohol
$224,502,971
$9,859
$3,440
$2,098,772,215
$9,931
$3,365
$6,790,955,100
$9,545
$3,040
Household
$138,973,375
$6,103
$2,129
$1,282,654,206
$6,069
$2,057
$3,853,870,832
$5,417
$1,725
Transportation & Maintenance
$214,428,844
$9,416
$3,286
$1,987,568,629
$9,404
$3,187
$6,283,994,771
$8,833
$2,813
Health Care
$37,891,080
$1,664
$581
$351,363,704
$1,663
$563
$1,083,310,736
$1,523
$485
Education & Daycare
$58,559,195
$2,572
$897
$554,747,638
$2,625
$889
$1,657,548,978
$2,330
$742
Total Specified Consumer Spending
$830,324,548
$36,463
$12,722
$7,766,634,494
$36,748
$12,453
$24,412,419,532
$34,314
$10,927
Traffic
Collection Street
Cross Street
Traffic Volume
Count Year
Distance from Property
195th Street
-
1,656
2026
0.16 mi
South Western Avenue
South Western Avenue N
32,238
2026
0.20 mi
Toyota Way
-
4,471
2026
0.25 mi
W 190th St
Harborgate Way E
29,850
2026
0.28 mi
West 190th Street
South Western Avenue W
30,879
2026
0.33 mi
W 190th St
Harborgate Way W
35,631
2026
0.36 mi
South Western Avenue
South Western Avenue S
30,521
2026
0.36 mi
San Diego Freeway
San Diego Freeway W
174,373
2026
0.39 mi
I 405
-
241,271
2026
0.41 mi
I- 405
S Western Ave W
6,979
2026
0.42 mi
COSTAR · PUBLIC RECORD
Public Record
Public Record fields retained under the same labels as the uploaded CoStar page.
Assessed Values
Assessed Year
Total Assessed
Improved Assessed
Land Assessed
% Improved
Tax Year
Tax Amount
2026
$97,820,384
$59,584,580
$38,235,804
60.91%
2025
$1,437,038.54
2025
$95,902,338
$58,416,255
$37,486,083
60.91%
2025
$1,437,038.54
2024
$94,021,901
$57,270,839
$36,751,062
60.91%
2024
$1,363,773.03
2023
$92,178,335
$56,147,882
$36,030,453
60.91%
2023
$1,341,059.78
2022
$90,370,918
$55,046,944
$35,323,974
60.91%
2022
$1,286,529.40
Parcel
Parcel ID
7351-003-013
Municipality Name
South /Torr/Lom/Hc Ind
Subdivision
City of Los Angeles
Zoning Code
LAM3
Latitude
33.854698
Longitude
-118.30735
Census Tract
292001
Land
Land SF
2,933,548 SF
Acres
67.35 AC
Legal Description
PARCEL MAP AS PER BK 56 PG 51 OF P M LOT B
Owner
Recorded Owner
BRIGHT SUN DISTRIBUTION L P
Mailing Address
19100 S Western Avenue, Suite 200 · Torrance, CA 90501
Last Sale
Transaction
Resale
Sale Date
9/19/1997
Recordation Date
9/30/1997
Transaction Type
Resale
Document #
1997.1508161
Contact Details
Buyer
Undisclosed
Seller
INTERNATIONAL LIGHT METALS CORP
Title Company
First American Title Co
Last Loan
Loan Details
Origination Date
9/10/2026
Loan Amount
$25,000,000
Loan Term
85 months
Maturity Date
10/5/2033
Transaction Type
Standalone Mortgage/Refinance
Document #
2026.678284
Contact Details
Borrower
BRIGHT SUN DISTRIBUTION LP
Borrower Address
19100 S Western Avenue, Suite 200 · Torrance, CA 90501
Originator
Northwestern Mutual Life Insur
Title Company
Chicago Title Company
Sale/Loan History
Loan Date
Loan Amount
Transaction
Originator
Borrower
9/10/2026
$25M
Standalone Mortgage/Refinance
Northwestern Mutual Life Insur
BRIGHT SUN DISTRIBUTION LP
8/31/2016
Undisclosed
Unknown
Undisclosed
BRIGHT SUN DISTRIBUTION LLP
6/15/2006
$64M
Standalone Mortgage/Refinance
The Northwestern Mutual Life Ins Co
BRIGHT SUN DISTRIBUTION LP
3/13/1998
$26M
Construction Loan
Fleet Ntl Bank
BRIGHT SUN DISTRIBUTION LP
9/19/1997
Undisclosed
Resale
—
Buyer · BRIGHT SUN DISTRIBUTION LP / Seller · INTERNATIONAL LIGHT METALS CORP
Loan origination dates remain as reported in the Public Record and Loan tabs.
COSTAR · CONTACTS
Contacts
Primary leasing contact and company information for the Harbor Gateway property page.
SHOP 310 LLC is a South Bay commercial real estate marketing studio founded by Miriam Choi. It brings practical property knowledge and thoughtful design together to help commercial properties communicate clearly online and in print. The studio works with brokers, owners, and investors to create accurate, polished digital property pages and marketing materials, with an emphasis on useful information, local context, and responsive service.
COSTAR · IMAGES
Images
A curated selection of fictional Harbor Gateway views, following the exterior, aerial, interior, and loading scenes shown in the original CoStar image set. Photos are illustrative concepts.
BUILDING PHOTOAERIALINTERIOR
DOCK EXTERIOROFFICE FRONTAGEAERIAL OVERVIEW
Plans · site, interior floor, and plat
The site, interior floor, and A–F plat references correspond to the same fictional campus.
SITE PLANINTERIOR FLOOR PLANPLAT PLAN · BUILDINGS A–F IN YELLOW
Site plan · Building A within the campus
The full illustrative Building A allocation is available; the surrounding A–F campus is shown for context.
BUILDING A · ENTIRE 114,316 SF AVAILABLEConceptual campus allocation · illustrative only
Building A · interior plan
Architectural-style warehouse schematic with the entire Building A allocation shaded as available; both conceptual restroom suites open to a shared hallway connected to the lobby.
BUILDING A · 114,316 SF ILLUSTRATIVE ALLOCATIONENTIRE BUILDING A AVAILABLEConceptual layout · not to scale or as-built
Plat plan · Buildings A–F highlighted
The uploaded CoStar plat map with Buildings A–F marked directly on the subject parcel.
BUILDINGS A–F · HIGHLIGHTED IN YELLOWBuilding A · 114,316 SF available
The A–F overlay follows the site plan’s equal building divisions and the property-page area basis: 114,316 SF each for A–E and 114,317 SF for F (rounding balance). The uploaded plat does not record these divisions; the yellow overlay is illustrative, not a survey.
COSTAR · MAP
Map
CoStar location reference and access details.
19100 S. Western AveApproximate location
COSTAR GOOGLE MAP · HARBOR GATEWAYApproximate reference · not a parcel boundary
Traffic counts · 2026
Street / cross street
Volume
Distance
195th Street
1,656
0.16 mi
South Western Ave / Western Ave N
32,238
0.20 mi
Toyota Way
4,471
0.25 mi
W 190th St / Harborgate Way E
29,850
0.28 mi
West 190th St / Western Ave W
30,879
0.33 mi
South Western Ave / Western Ave S
30,521
0.36 mi
San Diego Freeway / Freeway W
174,373
0.39 mi
I-405
241,271
0.41 mi
I-405 / S Western Ave W
6,979
0.42 mi
Airports & access
Long Beach Airport
15 min · 10.2 mi
Los Angeles International
18 min · 11.5 mi
Hollywood Burbank
42 min · 32.3 mi
Access scores
Car friendly
100 · Exceptionally friendly
Pedestrian friendly
50 · Fairly friendly
Transit friendly
50 · Fairly friendly
Cycling friendly
30 · Somewhat friendly
Location profile
Urban location · Torrance submarket · South Bay cluster · Los Angeles market · Los Angeles County, California · Los Angeles–Long Beach–Glendale CBSA · Los Angeles, CA–NV DMA · United States. Postcode 90501.
Flood risk
Moderate to low risk · FEMA Zones B and X · 100-year and 500-year floodplain area · not in a Special Flood Hazard Area.
FEMA map 06037C1935F · FIRM ID 06037C · panel 1935F · map date September 26, 2008.